Eclipses During 2009
Fred Espenak
To Be Published in Observer's Handbook 2009, Royal Astronomical Society of Canada
During the year 2009, two solar and four lunar eclipses occur as follows:
- 2009 Jan 26: Annular Solar Eclipse
- 2009 Feb 09: Penumbral Lunar Eclipse
- 2009 Jul 07: Penumbral Lunar Eclipse
- 2009 Jul 22: Total Solar Eclipse
- 2009 Aug 06: Penumbral Lunar Eclipse
- 2009 Dec 31: Partial Lunar Eclipse
Predictions for the eclipses are summarized in Figures 1, 2, 3, 4, 5, 6, 7, and 8. World maps show the regions of visibility for each eclipse. The lunar eclipse diagrams also include the path of the Moon through Earth's shadows. Contact times for each principal phase are tabulated along with the magnitudes and geocentric coordinates of the Sun and Moon at greatest eclipse.
All times and dates used in this publication are in Universal Time or UT. This astronomically derived time system is colloquially referred to as Greenwich Mean Time or GMT. To learn more about UT and how to convert UT to your own local time, see Time Zones and Universal Time.
Annular Solar Eclipse of January 26
The first solar eclipse of 2009 occurs at the Moon's ascending node in western Capricornus. An annular eclipse will be visible from a wide track that traverses the Indian Ocean and western Indonesia. A partial eclipse will be seen within the much larger path of the Moon's penumbral shadow, which includes the southern third of Africa, Madagascar, Australia except Tasmania, southeast India, Southeast Asia and Indonesia. (Figure 1).
The annular path begins in the South Atlantic at 06:06 UT when the Moon's antumbral shadow meets Earth and forms a 363 kilometre wide corridor. Traveling eastward, the shadow quickly sweeps south of the African continent, missing it by approximately 900 kilometres. Slowly curving to the northeast the path crosses the southern Indian Ocean. Greatest eclipse[1] takes place at 07:58:39 UT when the eclipse magnitude[2] will reach 0.9282. At this instant, the annular duration is 7 minutes 54 seconds, the path width is 280 kilometres and the Sun is 73° above the flat horizon formed by the open ocean. The central track continues northeast where it finally encounters land in the form of the Cocos Islands and onward to southern Sumatra and western Java (Figure 2). At 09:40 UT, the central line duration is 6 minutes 18 seconds and the Sun's altitude at 25°. In its final minutes, the antumbral shadow cuts across central Borneo and clips the northwestern edge of Celebes before ending just short of Mindanao, Philippines at 09:52 UT. During a 3 hour 46 minute trajectory across our planet, the Moon's antumbra travels approximately 14,500 kilometres and covers 0.9% of Earth's surface area. Path coordinates and central line circumstances are presented in Table 1.
Partial phases of the eclipse are visible primarily from southern Africa, Australia, Southeast Asia and Indonesia. Local circumstances for a number of cities are listed in Table 2. All times are given in Universal Time. The Sun's altitude and azimuth, the eclipse magnitude and obscuration[3] are all given at the instant of maximum eclipse.
This is the 50th eclipse of Saros 131. The family began with an unusually long series of 22 partial eclipses starting on 1125 Aug 01. The first central eclipse was total in the Northern Hemisphere on 1522 Mar 27. It was followed by 5 more total eclipses before the series produce 5 hybrid eclipses from 1630 to 1702. The first annular eclipse of Saros 131 occurred on 1720 Aug 04. The series will produce 29 more annular eclipses the last of which is 2243 Jun 18. Saros 131 terminates on 2369 Sep 02 after a string of 7 partial eclipses. Complete details for 70 eclipses in the series may be found at:
http://eclipse.gsfc.nasa.gov/SEsaros/SEsaros131.html
Penumbral Lunar Eclipse of February 09
The first lunar eclipse of 2009 is one of four such events during the year. The first three eclipses are penumbral while the last (on Dec. 31) is partial. The Feb 09 event is the deepest penumbral eclipse of the year with a penumbral magnitude of 0.899. It will be easily visible to the naked eye as a dusky shading in the northern half of the Moon. The times of the major phases are listed below.
Penumbral Eclipse Begins: 12:38:46 UTGreatest Eclipse: 14:38:15 UT
Penumbral Eclipse Ends: 16:37:40 UT
Of course, the beginning and end of a penumbral eclipse are not visible to the eye. In fact, no shading can be detected until about 2/3 of the Moon's disk is immersed in the penumbra. This would put the period of eclipse visibility from approximately 14:00 to 15:20 UT. Keep in mind that this is only an estimate. Atmospheric conditions and the observer's visual acuity are important factors to consider. An interesting exercise is to note when penumbral shading is first and last seen.
Figure 3 shows the path of the Moon through the penumbra as well as a map of Earth showing the regions of eclipse visibility. Eastern Canada and the USA will miss the eclipse entirely since the eclipse begins after moonset. Observers in western Canada and the USA will have the best views with moonset occurring sometime after mid-eclipse. To catch the entire event, one must be in Alaska, Hawaii, Australia, or East Asia.
Penumbral Lunar Eclipse of July 07
July's penumbral eclipse is only of academic interest since the magnitude is just 0.156. Although the Moon will be above the horizon from most of Canada (Figure 4), the eclipse is so minor as to be completely invisible to the naked eye.
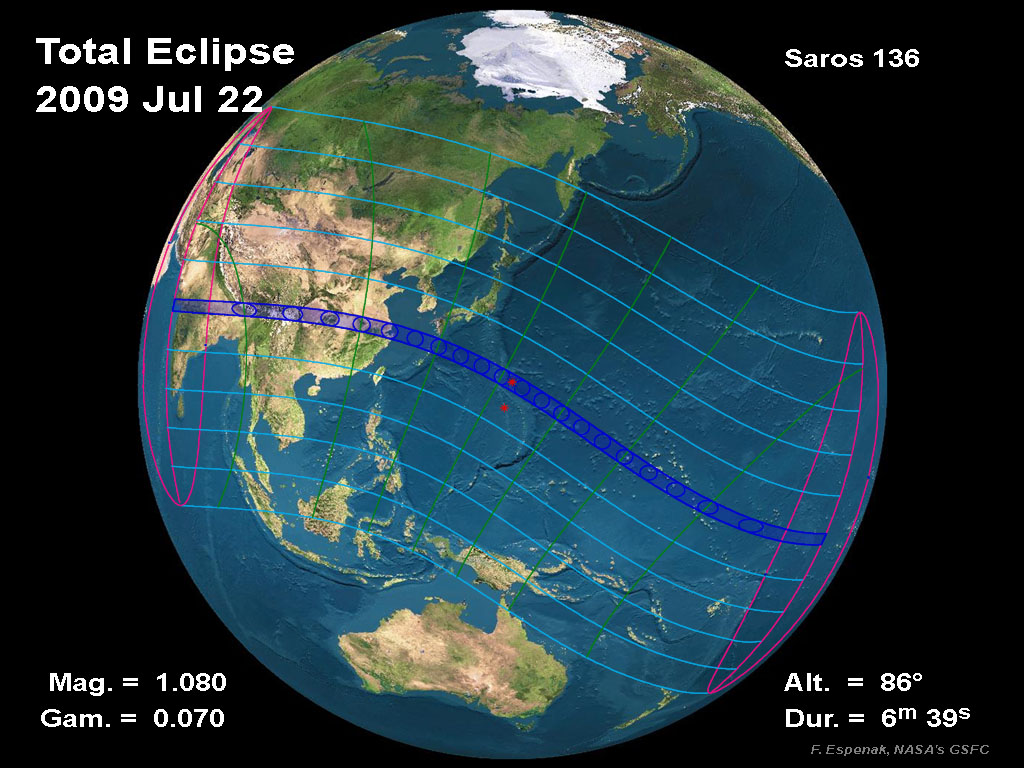
Total Solar Eclipse of July 22
To make up for the anemic lunar eclipse earlier in the month, a major total eclipse of the Sun occurs two weeks later. The path of the Moon's umbral shadow extends across India, China, a handful of Japanese islands and the South Pacific Ocean (Espenak and Anderson, 2008). A partial eclipse is seen within the much broader path of the Moon's penumbral shadow, which includes most of eastern Asia, Indonesia, and the Pacific Ocean (Figure 5).
The central path begins in India's Gulf of Khambhat at 00:53 UT. The Moon passes through perigee several hours earlier, so the path of totality is unusually wide.
Racing inland, the shadow sweeps over the Indian cities of Surat, Indore, Bhopal, Varanasi, and Pata as its central duration heads towards the 4-minute mark. Traveling across Bhutan, the umbra clips Nepal, Bangladesh, and Burma (Myanmar), before reaching China at 01:05 UT (Figure 6). The duration of totality surpasses 5 minutes in Sichuan province where its capital city Chengdu lies within the track 85 km north of the central line. The umbra works its way across the rest of southern China where the major cities of Chongqing, Wuhan and Hangzhou stand in the eclipse path.
As the Moon's shadow reaches the coast, China's largest city Shanghai (pop. ~19 million) experiences totality lasting 5 minutes at 01:39 UT. Around 70 km to the south, the central line duration falls just 5 seconds short of the 6-minute mark. Across the East China Sea, the umbra sweeps over Japan's Ryukyu Islands and Iwo Jima.
Greatest eclipse occurs in the South Pacific at 02:35:19 UT. At this instant, the axis of the Moon's shadow passes closest to Earth's center. The maximum duration of totality is 6_minutes 39_seconds, the Sun's altitude is 86°, and the path width is 258_km. The remainder of the path makes no major landfall; it arcs southeast through the Pacific hitting just a handful of small atolls in the Marshall Islands and Kiribati (Gilbert Islands).
The path of totality ends at 04:18 UT as the lunar shadow leaves Earth and returns to space 3.4 hours after it started its trek across our planet's surface. The 15,200 km long track covers 0.71% of Earth's surface. Path coordinates and central line circumstances are presented in Table 3.
A partial eclipse is seen from a much larger area covering East Asia, Indonesia, and the South Pacific. Local circumstances for a number of cities are listed in Table 4. All times are given in Universal Time. The Sun's altitude and azimuth, the eclipse magnitude and obscuration are all given at the instant of maximum eclipse.
This is the 37th eclipse of Saros 136. The series began on 1360 Jun 14 with the first of eight partial eclipses. The first central eclipse was annular on 1504 Sep 08. It was followed by 5 more annular eclipses before the series produced 6 hybrid eclipses from 1612 through 1703. The first total eclipse occurred on 1721 Jan 27. The central line duration of this series rapidly increased and peaked at 7 minutes 8 seconds on 1955 Jun 20. Since then, the duration is slowly decreasing. Of particular note is the 6-minute total eclipse passing through the central U. S. on 2045 Aug 12. The series will continue to produce total eclipses until 2496 May 13. After that, the family winds down with a string of 7 partial eclipses which ends on 2622 Jul 30. In all, Saros 136 produces 15 partial, 6 annular, 6 hybrid and 44 total eclipses. Complete details for the series can be found at:
http://eclipse.gsfc.nasa.gov/SEsaros/SEsaros136.html
Penumbral Lunar Eclipse of August 06
A shallow penumbral eclipse occurs 15 days after the total solar eclipse. Since its magnitude is only 0.402, it will not be visible to the naked eye. Details for the eclipse can be found in Figure 7.
Partial Lunar Eclipse of December 31
The last eclipse of 2009 occurs on New Year's Eve. This minor partial lunar eclipse takes place in Gemini, and is visible primarily from the Eastern Hemisphere (Figure 8). Greatest eclipse takes place at 19:23 UT when the eclipse magnitude will reach 0.0763.
Solar Eclipse Figures
For each solar eclipse, an orthographic projection map of Earth shows the path of penumbral (partial) and umbral (total) or antumbral (annular) eclipse. North is to the top in all cases and the daylight terminator is plotted for the instant of greatest eclipse. An asterisk (*) indicates the sub-solar point[4] on Earth.
The limits of the Moon's penumbral shadow delineate the region of visibility of the partial solar eclipse. This irregular or saddle shaped region often covers more than half of the daylight hemisphere of Earth and consists of several distinct zones or limits. At the northern and/or southern boundaries lie the limits of the penumbra's path. Partial eclipses have only one of these limits, as do central eclipses when the Moon's shadow axis falls no closer than about 0.45 radii from Earth's centre. Great loops at the western and eastern extremes of the penumbra's path identify the areas where the eclipse begins/ends at sunrise and sunset, respectively. If the penumbra has both a northern and southern limit, the rising and setting curves form two separate, closed loops. Otherwise, the curves are connected in a distorted figure eight. Bisecting the 'eclipse begins/ends at sunrise and sunset' loops is the curve of maximum eclipse at sunrise (western loop) and sunset (eastern loop). The points P1 and P4 mark the coordinates where the penumbral shadow first contacts (partial eclipse begins) and last contacts (partial eclipse ends) Earth's surface. If the penumbral path has both a northern and southern limit, then points P2 and P3 are also plotted. These correspond to the coordinates where the penumbral shadow cone is internally tangent to Earth's disk.
A curve of maximum eclipse is the locus of all points where the eclipse is at maximum at a given time. Curves of maximum eclipse are plotted at each half-hour Universal Time. They generally run between the penumbral limits in the north/south direction, or from the maximum eclipse at sunrise and sunset curves to one of the limits. If the eclipse is central (i.e. total or annular), the curves of maximum eclipse run through the outlines of the umbral shadow, which are plotted at ten-minute intervals. The curves of constant eclipse magnitude delineate the locus of all points where the magnitude at maximum eclipse is constant. These curves run exclusively between the curves of maximum eclipse at sunrise and sunset. Furthermore, they are parallel to the northern/southern penumbral limits and the umbral paths of central eclipses. In fact, the northern and southern limits of the penumbra can be thought of as curves of constant magnitude of 0.0. The adjacent curves are for magnitudes of 0.2, 0.4, 0.6 and 0.8. For total eclipses, the northern and southern limits of the umbra are curves of constant magnitude of 1.0. Umbral path limits for annular eclipses are curves of maximum eclipse magnitude.
Greatest eclipse is defined as the instant when the axis of the Moon's shadow passes closest to Earth's centre. Although greatest eclipse differs slightly from the instants of greatest magnitude and greatest duration (for total eclipses), the differences are negligible. The point on Earth's surface intersected by the axis at greatest eclipse is marked by an asterisk symbol. For partial eclipses, the shadow axis misses Earth entirely, so the point of greatest eclipse lies on the day/night terminator and the Sun appears on the horizon.
Data pertinent to the eclipse appear with each map. At the top are listed the instant of ecliptic conjunction of the Sun and Moon (i.e., New Moon) and the instant of greatest eclipse, expressed in Terrestrial Dynamical Time and Universal Time. The eclipse magnitude is defined as the fraction of the Sun's diameter obscured by the Moon at greatest eclipse. For central eclipses (total or annular), the magnitude is replaced by the geocentric ratio of diameters of the Moon and the Sun. Gamma is the minimum distance of the Moon's shadow axis from Earth's centre in Earth radii at greatest eclipse. The Saros series of the eclipse is listed, followed by the member position. The first member number identifies the sequence position of the eclipse in the Saros, while the second is the total number of eclipses in the series.
In the upper left and right corners are the geocentric coordinates of the Sun and the Moon, respectively, at the instant of greatest eclipse. They are:
R.A. - Right Ascension
Dec. - Declination
S.D. - Apparent Semi-Diameter
H.P. - Horizontal Parallax
To the lower left are exterior/interior contact times of the Moon's penumbral shadow with Earth, which are defined:
P1 - Instant of first exterior tangency of Penumbra with Earth's limb. (Partial Eclipse Begins)
P2 - Instant of first interior tangency of Penumbra with Earth's limb.
P3 - Instant of last interior tangency of Penumbra with Earth's limb.
P4 - Instant of last exterior tangency of Penumbra with Earth's limb. (Partial Eclipse Ends)
Not all eclipses have P2 and P3 penumbral contacts. They are only present in cases where the penumbral shadow falls completely within Earth's disk. For central eclipses, the lower right corner lists exterior/interior contact times of the Moon's umbral shadow with Earth's limb which are defined as follows:
U1 - Instant of first exterior tangency of Umbra with Earth's limb. (Umbral [Total/Annular] Eclipse Begins)
U2 - Instant of first interior tangency of Umbra with Earth's limb.
U3 - Instant of last interior tangency of Umbra with Earth's limb.
U4 - Instant of last exterior tangency of Umbra with Earth's limb. (Umbral [Total/Annular] Eclipse Ends)
At bottom centre are the geographic coordinates of the position of greatest eclipse along with the local circumstances at that location (i.e., Sun altitude, Sun azimuth, path width and duration of totality/annularity). At bottom left is a list of parameters used in the eclipse predictions, while bottom right gives the Moon's geocentric libration (optical + physical) at greatest eclipse.
Lunar Eclipse Figures
Each lunar eclipse has two diagrams associated with it along with data pertinent to the eclipse. The top figure shows the path of the Moon through Earth's penumbral and umbral shadows. Above this figure are listed the instant of ecliptic conjunction of the Moon with the point 180° from the Sun (i.e., Full Moon) and the instant of greatest eclipse, expressed in Terrestrial Dynamical Time and Universal Time. The penumbral and umbral magnitudes are defined as the fraction of the Moon's diameter immersed in the two shadows at greatest eclipse. The radii of the penumbral and umbral shadows, P. Radius and U. Radius, are also listed. Gamma is the minimum distance in Earth radii of the Moon's centre from Earth's shadow axis at greatest eclipse, and Axis is the same parameter expressed in degrees. The Saros series of the eclipse is listed, followed by a pair of numbers. The first number identifies the sequence position of the eclipse in the Saros; the second is the total number of eclipses in the series.
In the upper left and right corners are the geocentric coordinates of the Sun and the Moon, respectively, at the instant of greatest eclipse. They are:
R.A. - Right Ascension
Dec. - Declination
S.D. - Apparent Semi-Diameter
H.P. - Horizontal Parallax
To the lower left are the semi, or half, durations of the penumbral, and partial (umbral) eclipses. Below them are the extrapolated value of ΔT (the difference between Terrestrial Dynamical Time and Universal Time) and the Sun/Moon ephemerides used in the predictions. To the lower right are the contact times of the Moon with Earth's penumbral and umbral shadows, defined as follows:
P1 - Instant of first exterior tangency of Moon with Penumbra. (Penumbral Eclipse Begins)
U1 - Instant of first exterior tangency of Moon with Umbra. (Partial Umbral Eclipse Begins)
U2 - Instant of first interior tangency of Moon with Umbra. (Total Umbral Eclipse Begins)
U3 - Instant of last interior tangency of Moon with Umbra. (Total Umbral Eclipse Ends)
U4 - Instant of last exterior tangency of Moon with Umbra (Partial Umbral Eclipse Ends)
P4 - Instant of last exterior tangency of Moon with Penumbra. (Penumbral Eclipse Ends)
The bottom figure is a cylindrical equidistant projection map of Earth that shows the regions of visibility for each stage of the eclipse. In particular, the moonrise/moonset terminator is plotted for each contact and is labeled accordingly. An asterisk indicates the point where the Moon is in the zenith at greatest eclipse. The region that is unshaded will observe the entire eclipse, while the darkly shaded area will witness no eclipse. The remaining lightly shaded areas will experience moonrise or moonset while the eclipse is in progress. The shaded zones east of the asterisk will witness moonset before the eclipse ends, and the shaded zones west will witness moonrise after the eclipse has begun.
Shadow Diameters and Lunar Eclipses
To compensate for Earth's atmosphere when calculating the circumstances for lunar eclipses, Chauvenet [1891] introduced an empirical enlargement of 1/50 to the diameters of the umbral and penumbral shadows. This rule has been employed by many of the national institutes in their official eclipse predictions (including the author's work at NASA). However, Danjon [1951] pointed out a flaw in this method because it applies the same relative correction to the umbra and penumbra instead of using the same absolute correction. From eclipse observations, Danjon proposed to enlarge Earth's diameter by 1/85 to compensate for the atmosphere. The umbral and penumbral shadow diameters are then calculated based on this modified geometry. The French almanac "Connaissance des Temps" has used the Danjon rule in its eclipse predictions since 1951. The resulting umbral and penumbral eclipse magnitudes are smaller by approximately 0.005 and 0.026, respectively, as compared to predictions using the traditional 1/50 rule.
Beginning with Eclipses During 2007, we use the Danjon rule in calculating lunar eclipse circumstances and magnitudes.
Eclipse Altitudes and Azimuths
The altitude a and azimuth A of the Sun or Moon during an eclipse depend on the time and the observer's geographic coordinates. They are calculated as follows:
h = 15 (GST + UT - α ) + λa = arcsin [sin δ sin φ + cos δ cos h cos φ]
A = arctan [-(cos δ sin h)/(sin δ cos φ - cos δ cos h sin φ)]
where
h = hour angle of Sun or Moon
a = altitude
A = azimuth
GST = Greenwich Sidereal Time at 0:00 UT
UT = Universal Time
α = right ascension of Sun or Moon
δ = declination of Sun or Moon
λ = observer's longitude (east +, west -)
φ = observer's latitude (north +, south -)
During the eclipses of 2009, the values for GST and the geocentric Right Ascension and Declination of the Sun or the Moon (at greatest eclipse) are as follows:
Eclipse Date GST α δAnnular Solar 2009 Jan 26 8.383 20.592 -18.649
Penumbral Lunar 2009 Feb 09 9.321 9.528 13.527
Penumbral Lunar 2009 Jul 07 19.033 19.136 -23.861
Total Solar 2009 Jul 22 19.999 8.107 20.267
Penumbral Lunar 2009 Aug 06 20.979 21.046 -15.576
Partial Lunar 2009 Dec 31 6.690 6.756 24.020
Two web based tools that can also be used to calculate the local circumstances for all solar and lunar eclipses visible from any location. They are the Javascript Solar Eclipse Explorer and the Javascript Lunar Eclipse Explorer. The URLs for these tools are:
http://eclipse.gsfc.nasa.gov/JSEX/JSEX-index.html
http://eclipse.gsfc.nasa.gov/JLEX/JLEX-index.html
Eclipses During 2010
In 2010, there are two solar and two lunar eclipses:
- 2010 Jan 15: Annular Solar Eclipse
- 2010 Jun 26: Partial Lunar Eclipse
- 2010 Jul 11: Total Solar Eclipse
- 2010 Dec 21: Total Lunar Eclipse
A full report on eclipses during 2010 will be published in Observer's Handbook 2010.
NASA Solar Eclipse Bulletins
Special bulletins containing detailed predictions and meteorological data for future solar eclipses of interest are prepared by Fred Espenak and Jay Anderson and are published through NASA’s Publication series. The bulletins are provided as a public service to both the professional and lay communities, including educators and the media. A list of currently available bulletins and an order form can be found at:
http://eclipse.gsfc.nasa.gov/SEpubs/RPrequest.html
The most recent bulletin of the series covers the total solar eclipse of 2008 August 01 which is visible from northern Canada, Russia, Mongolia and China. Single copies of the eclipse bulletins are available at no cost by sending a 9 x 12-in. self-addressed envelope stamped with postage for 11 oz. (310 g). Please print the eclipse year on the envelope’s lower left corner. Use stamps only, since cash and cheques cannot be accepted. Requests from outside the United States and Canada may include 10 international postal coupons. Mail requests to: Fred Espenak, NASA's Goddard Space Flight Center, Code 693, Greenbelt MD 20771, USA.
The NASA eclipse bulletins are also available over the Internet, including out-of-print bulletins. Using a Web browser, they can be read or downloaded through the NASA Eclipse Web Page at:
http://eclipse.gsfc.nasa.gov/SEpubs/bulletin.html
Eclipse Web Sites
The URL of the NASA Eclipse Web Site is:
http://eclipse.gsfc.nasa.gov/eclipse.html
The site features predictions and maps for all solar and lunar eclipses well into the 21st century, with special emphasis on upcoming eclipses. Special pages are devoted to the total solar eclipses of 2008, 2009 and 2010 that feature detailed maps, tables, graphs, and meteorological data. A world atlas of solar eclipses provides maps of all central eclipse paths from 2000 BCE to 3000 CE. The entire Five Millennium Canon of Solar Eclipses [Espenak and Meeus, 2006] can be downloaded in PDF format and all maps are also available online as individual GIFs or PDFs Additional catalogues list every solar and lunar eclipse over a 5000-year period.
A special web site is available for the 2009 total solar eclipse. It contains detailed maps, tables and meteorological data' The URL is:
http://eclipse.gsfc.nasa.gov/SEmono/TSE2009/TSE2009.html
Detailed information on solar and lunar eclipse photography and tips on eclipse observing and eye safety may be found at:
Acknowledgments
Special thanks to National Space Club summer intern Wesley Ripley for converting the MS Word manuscript to html for this web page (July 2008).
All eclipse predictions were generated on a Macintosh G4 PowerPC computer using algorithms developed from the Explanatory Supplement [1974] with additional algorithms from Meeus, Grosjean, and Vanderleen [1966]. The solar coordinates used in the eclipse predictions are based on VSOP87 [P. Bretagnon and G. Francou, 1988]. The lunar coordinates are based on ELP-2000/82 [M. Chapront-Touzé and J. Chapront, 1983]. For lunar eclipses, the diameter of the umbral and penumbral shadows were calculated using Danjon's rule of enlarging Earth's radius by 1/85 to compensate for the opacity of the terrestrial atmosphere; corrections for the effects of oblateness have also been included.
All calculations, diagrams, tables, and opinions presented in this paper are those of the author, and he assumes full responsibility for their accuracy.
Footnotes
[1] The instant of greatest eclipse occurs when the distance between the Moon's shadow axis and Earth's geocentre reaches a minimum.
[2] Eclipse magnitude is defined as the fraction of the Sun's diameter occulted by the Moon.
[3] Eclipse obscuration is defined as the fraction of the Sun's area occulted by the Moon.
[4] The sub-solar point is the geographic location where the Sun appears directly overhead (zenith).
References
Bretagnon P., Francou G., "Planetary Theories in rectangular and spherical variables: VSOP87 solution", Astron. and Astrophys., vol. 202, no. 309 (1988).
Chapront-Touzé, M and Chapront, J., "The Lunar Ephemeris ELP 2000," Astron. and Astrophys., vol. 124, no. 1, pp 50-62 (1983).
Chauvenet, W., Manual of Spherical and Practical Astronomy, Vol.1, 1891 (Dover edition 1961).
Danjon, A., "Les éclipses de Lune par la pénombre en 1951," L'Astronomie, 65, 51-53 (Feb. 1951).
Espenak, F., Fifty Year Canon of Solar Eclipses: 1986-2035, Sky Publishing Corp., Cambridge, MA, 1988
Espenak, F., Fifty Year Canon of Lunar Eclipses: 1986-2035, Sky Publishing Corp., Cambridge, MA, 1989.
Espenak, F., and Anderson, J., Total Solar Eclipse of 2009 July 22, NASA TP-2008-214169, Goddard Space Flight Center, Greenbelt, MD, 2008.
Espenak, F., and Meeus, J., Five Millennium Canon of Solar Eclipses: -2000 to +3000 (2000 BCE to 3000 CE), NASA TP-2006-214141, Goddard Space Flight Center, Greenbelt, MD, 2006.
Explanatory Supplement to the Astronomical Ephemeris and the American Ephemeris and Nautical Almanac, Her Majesty's Nautical Almanac Office, London, 1974.
Littmann, M., Espenak, F., & Willcox, K., Totality-Eclipses of the Sun, 3rd Ed., Oxford University Press, New York, 2008.
Meeus, J., Grosjean, C.C., & Vanderleen, W., Canon of Solar Eclipses, Pergamon Press, New York, 1966.
Meeus, J. & Mucke, H., Canon of Lunar Eclipses: -2002 to +2526, Astronomisches Buro, Wien, 1979.
Total Solar Eclipse of 2009 July 22
On Wednesday, 2009 July 22, a total eclipse of the Sun is visible from within a narrow corridor that traverses half of Earth. The path of the Moon's umbral shadow begins in India and crosses through Nepal, Bangladesh, Bhutan, Myanmar and China. After leaving mainland Asia, the path crosses Japan's Ryukyu Islands and curves southeast through the Pacific Ocean where the maximum duration of totality reaches 6 min 39 s. A partial eclipse is seen within the much broader path of the Moon's penumbral shadow, which includes most of eastern Asia, Indonesia, and the Pacific Ocean.
This web site has been established for the purpose of providing detailed predictions, maps, figures and information about this important event. The material here is adapted from the NASA Technical Publication "Total Solar Eclipse of 2009 July 22" (NASA/TP-2008-214169). The document will be published in 2008 March. It is part of NASA's official eclipse bulletin publication series. Instructions and a form for ordering a hard copy of this publication can be found at: Order Form for NASA Eclipse Bulletins.
Preliminary Look at the Total Solar Eclipse of 2009 Jul 22
- Figure 1 - Orthographic (Global) Projection of the 2009 Total Solar Eclipse
- Figure 2 - 2009 Eclipse Path Through India, Nepal, Bhutan, and Bangladesh
- Figure 3 - 2009 Eclipse Path Through China
- Figure 4 - 2009 Eclipse Path Through Southern Japan
- Figure 5 - 2009 Eclipse Path Through the Marshall and Gilbert Islands
- Figure 6 - Mean Cloudiness in July Along the 2009 Eclipse Path (from satellite imaging)
- Figure 7 - Climate Statistics for July Along the 2009 Eclipse Path
- Figure 8 - Average July Cloudiness Along the 2009 Eclipse Path
This data was presented at: IAU Symposium 233 - Solar Activity and Its Magnetic Origin
See also: Eclipse Weather and Maps (Jay Anderson)
Interactive Map of the Path of Totality
An implementation of Google Map has been created which includes the central path of the 2009 total solar eclipse. This allows the user to select any portion of the path and to zoom in using either map data or Earth satellite data.
General Maps of the Eclipse Path
The following maps show the overall regions of visibility of the partial eclipse as well as the path of the total eclipse through Asia and the Pacific Ocean. They use high resolution coastline data from the World Data Base II (WDB). Each map was chosen to isolate a specific region along the land portion of the eclipse path. Curves of maximum eclipse are included as well as the outline of the umbral shadow.
The maps are available as high resolution (300 dpi) PDF files.
| Figure Number | Title/Description | Map File |
| Figure 1 | Orthographic (Global) Map of 2009 Total Solar Eclipse | |
| Figure 2 | Map of 2009 Eclipse Path Through Asia | |
| Figure 3 | Map of 2009 Eclipse Path Through India and Bhutan | |
| Figure 4 | Map of 2009 Eclipse Path Through China | |
| Figure 5 | Map of 2009 Eclipse Path South of Japan |
From NASA Tech. Pub. "Total Solar Eclipse of 2009 July 22" (NASA/TP-2008-214169).
Detailed Maps of the Path of Totality
The following maps show path of the 2009 total eclipse in greater detail. They use high resolution coastline, city and highway data from the Digital Chart of the World (DCW). Each map was chosen to isolate a specific region along the land portion of the eclipse path. Curves of maximum eclipse are included as well as the outline of the umbral shadow. Within the umbral path, curves of constant duration have been plotted for totality.
The maps are available as high resolution (300 dpi) PDF files.
| Figure Number | Title/Description | Map File |
| Figure 6 | India - Mumbai | |
| Figure 7 | India - Bhopal | |
| Figure 8 | India (Patna) - Nepal | |
| Figure 9 | India - Bhutan | |
| Figure 10 | India - Burma - China | |
| Figure 11 | China - Chengdu | |
| Figure 12 | China - Chongquig | |
| Figure 13 | China - Wuhan | |
| Figure 14 | China - Shanghai | |
| Figure 15 | Japan - Ryukyu Islands | |
| Figure 16 | Japan - Iwo Jima | |
| Figure 17 | Marshall Islands | |
| Figure 18 | Kiribati | |
| Figure 19 | Phoenix Islands |
From NASA Tech. Pub. "Total Solar Eclipse of 2009 July 22" (NASA/TP-2008-214169).
Additional Figures
The following figures also appear in the NASA/TP-2008-214169, "Total Solar Eclipse of 2009 July 22".
| Figure Number | Title/Description | Figure File |
| Figure 20 | Lunar Limb Profile for July 22 at 01:30 UT | |
| Figure 21 | Average July Cloud Amount Along the Central Line | |
| Figure 22 | Number of Typhoons from 1955 to 2007 | |
| Figure 23 | Spectral Response of Common Solar Filters | |
| Figure 24 | Focal Length Vs. Image Size for Eclipse Photography | |
| Figure 25 | Sky During Totality from Central Line at 01:30 UT |
From NASA Tech. Pub. "Total Solar Eclipse of 2009 July 22" (NASA/TP-2008-214169).
Supplementary Figures
The following figures do not appear in the NASA 2009 Eclipse Bulletin due to page constraints. They are presented here as supplementary material for the bulletin.
| Figure Number | Title/Description | Figure File |
| Figure 20b | Lunar Limb Profile for July 22 at 00:55 UT | |
| Figure 20c | Lunar Limb Profile for July 22 at 02:00 UT | |
| Figure 20d | Lunar Limb Profile for July 22 at 03:45 UT | |
| Figure 20e | Lunar Limb Profile for July 22 at 04:15 UT | |
| Figure 25b | Sky During Totality from Central India at 00:55 UT | |
| Figure 25c | Sky During Totality from South of Japan at 02:00 UT | |
| Figure 25d | Sky During Totality from Marshall Islands at 03:45 UT | |
| Figure 25e | Sky During Totality from Phoenix Islands at 04:15 UT |
Eclipse Elements, Shadow Contacts and Path of Totality
The following tables give detailed predictions including the Besselian Elements, shadow contacts with Earth, path of the umbral shadow and topocentric data (with path corrections) along the path. Also included are special extended version tables of path coordinates and graze zones in formats convenient for plotting on maps.
- Table 1 - Elements of the Eclipse
- Table 2 - Shadow Contacts and Circumstances
- Table 3 - Path of the Umbral Shadow
- Table 4 - Physical Ephemeris of the Umbral Shadow
- Table 5 - Local Circumstances on the Central Line
- Table 6 - Topocentric Data and Path Corrections Due to Lunar Limb Profile
- Table 7a - Mapping Coordinates for the Umbral Path
- Table 7b - Mapping Coordinates for the Umbral Path (Extended - 7.5´ step size)
- Table 8a - Mapping Coordinates for the Zones of Grazing Eclipse
- Table 8b - Mapping Coordinates for the Zones of Grazing Eclipse (Extended - 7.5´ step size)
From NASA Tech. Pub. "Total Solar Eclipse of 2009 July 22" (NASA/TP-2008-214169).
Local Circumstances
The following tables give the local circumstances of the eclipse from various cities throughout Asia and the Pacific Ocean. All contact times are given in the tables are in Universal Time.
- Tables 09 - Local Circumstances for India
- Table 10 - Local Circumstances for China - 1
- Table 11 - Local Circumstances for China - 2
- Table 12 - Local Circumstances for Asia
- Table 13 - Local Circumstances for Southeast Asia
- Table 14 - Local Circumstances for Japan and Pacific
From NASA Tech. Pub. "Total Solar Eclipse of 2009 July 22" (NASA/TP-2008-214169).
Additional Tables
The following tables also appear in the NASA/TP-2008-214169, "Total Solar Eclipse of 2009 July 22".
- Table 15 - Solar Eclipses of Saros Series 136
- Table 16 - Climate Statistics Along the 2009 Eclipse Path
- Table 17 - Cloud and Sunshine Statistics Along the 2009 Eclipse Path
- Tables 18 & 19 - Eclipse Photography
Explanation of Eclipse Maps and Tables
The following links give detailed descriptions and explanations of the eclipse maps and tables.
- Map 1 - Orthographic Map of the Eclipse Path
- Table 1 - Elements of the Eclipse
- Table 2 - Shadow Contacts and Circumstances
- Table 3 - Path of the Umbral (or Antumbral) Shadow
- Table 4 - Physical Ephemeris of the Umbral (or Antumbral) Shadow
- Table 5 - Local Circumstances on the Central Line
- Table 6 - Topocentric Data and Path Corrections Due to Lunar Limb Profile
- Table 7 - Mapping Coordinates for the Central Path
- Table 8 - Coordinates for the Zones of Grazing Eclipse
- Mean Lunar Radius
- Lunar Limb Profile
- Limb Corrections to the Path Limits: Graze Zones
- Local Circumstances Tables for Total Solar Eclipses
Reproduction of Eclipse Data
All eclipse calculations are by Fred Espenak, and he assumes full responsibility for their accuracy. Permission is freely granted to reproduce this data when accompanied by an acknowledgment:
"Eclipse Predictions by Fred Espenak, NASA's GSFC"
For more information, see: NASA Copyright Information
Responsible NASA Official: Amy Simon-Miller (amy.a.simon-miller@nasa.gov)
No comments:
Post a Comment